A Brief Introduction to Input-Output Tables
Input-output tables (IO tables) to an economist are like nutrition manuals to a dietician. Just as dieticians refer to nutrition manuals to determine how particular foods are digested and distributed around the patient’s body, economists refer to IO tables to determine how particular products are digested and distributed around the economy.
In the 17th century, French economist and physician François Quesnay (1694 – 1774) perceived the economy in precisely this way. Influenced by his training as a master surgeon, Quesnay produced one of the first analytical frameworks of the economy, the Tableau Économique, which was redolent of the flowing, coordinated nature of different parts within the human body.
215 years later in 1974, Wassily Leontief (1906 – 1999) went on to win a Nobel Prize “for the development of the input-output method and for its application to important economic problems”. The resemblance between the two analytical frameworks is striking. IO tables, like the Tableau Économique, capture the interconnections between four of the most basic and fundamental economic activities: the production, consumption, accumulation, and trading of goods.
The insights from IO tables serve many purposes, all of which contribute to understanding the structural workings of any economy. Today, these tables play an instrumental role in the justification of important figures such as national accounts, and often underpin economic impact studies for projects and policy measures such as tax levels and subsidies.
This article will focus on the latest (FY 2016-17) IO table for Australia produced by the ABS. Here the relevant table is labelled “Industry by industry flow table (direct allocation of imports)”. The column and row interpretations of this IO table will be explained, with examples of such interpretations focusing on the Beer Manufacturing industry.
Industry linkages and flow-on impact interpretations:
As seen in the “Australian Production” row, the Beer Manufacturing Industry produced $4,092 million of output in 2016-17. The IO table tells us that it used $581 million of products from the Sheep, Grains, Beef and Dairy Cattle industry in its production process – most likely requiring more barley and hops than livestock! Therefore, we can say that around 14% of the Beer Manufacturing industry’s total Australian Production is directly dependent upon the Grains industry.

Source: ABS IO table
IO tables can also be used to analyze flow-on effects for a broad range of economic scenarios. Through analysis of inter-industry dependence, IO tables offer insight into how certain industries would react to collapses in others. Conversely, IO tables can be used to understand where growth within an economy would be required to facilitate expansion in an industry of interest.
Indeed, the structural and mechanical lens of IO tables emphasises the interconnectedness of economic processes. Accordingly, the Australian IO table suggests that for Beer Manufacturing to expand, grains production would need to expand as well.
Tracking products to their final consumption:
IO tables provide highly detailed information on the ultimate location of an industry’s products. Specifically, IO tables tell us how much of an industry’s output is used by other industries, consumed by households or government, invested by the private sector or government, or exported. As such, IO tables can be used to gauge which bodies of consumers are most important to particular industries.
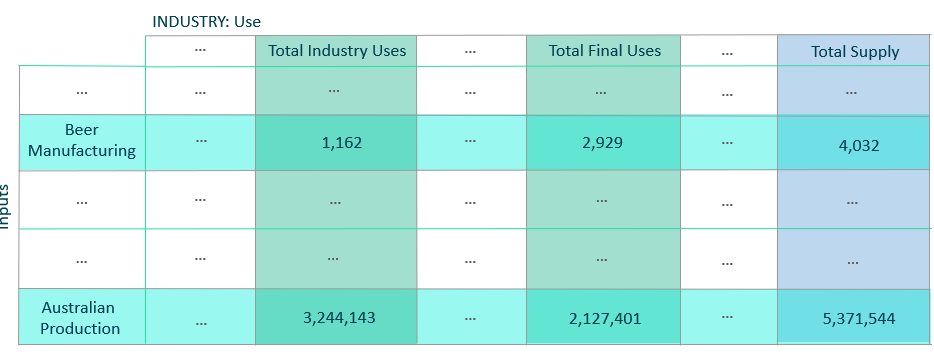
Perhaps unsurprisingly, $2,372 million of Beer Manufacturing products are consumed by households, which accounts for approximately 58% of the industry’s total supply and more than double of the total industry uses of such products.

Source: ABS IO table
Importantly, IO tables split the use of products by their Total Industry Use (intermediate goods) and Total Final Use (immediate consumption), and then sums these two values to find the Total Supply of a given industry’s products.

Source: ABS IO table
Reading across the rows of an IO table, we can see the total demand of an industry’s products and in which sectors of the economy these products are ultimately consumed. As such, reading along the rows of an IO table yields the following interpretation: “industry x sells n products to industry y”.
Returning to our Beer Manufacturing case study, we can see that the Beer Manufacturing industry sells $166 and $688 million of products to the Accommodation and Food and Beverage Services industries, respectively. This accounts for 74% of the Beer Manufacturing industry’s Total Industry Uses, which is indicative of inter-industry dependence.

Source: ABS IO table
Concluding note:
IO tables are a great tool for understanding the inner workings of economies. For this reason, IO tables have often been regarded as the lynchpin of centrally planned economies, as they give the impression of “objective economic law”. According to the RAND Institute, the Soviet Union was a good example of how aggressive economic policy, underpinned by mathematics, was employed to encourage strong growth within selected industries. However, after a series of undeniable economic failures, in 1963 the Soviet economist Stanislav Strumilin eloquently diagnosed the core problem of such economic planning:
There is a fundamental difference in kind between mathematics and economics… The laws of economics are connections of qualitative character, while those of mathematics are quantitative connections.
Despite only briefly introducing the application of IO tables, we hope that this overview has demonstrated their potential to provide information on the most fundamental processes that occur within every modern economy: the production, consumption, accumulation, and trade of goods.
This article was prepared by Ben Scott, Research Assistant, and Gene Tunny, Director, of Adept Economics. Please get in touch with any questions or comments to ben.scott@adepteconomics.com.au.